The project that almost got me a job: analysis of house rentals in Mexico City

After applying to a certain real state start-up as a data engineer, they gave me a take home project. Even though I was not selected for the position, my interviewers actually liked the project’s result. Anyway, the project consisted of building a simple ETL pipeline for 2 datasets, as well as a set of 3 questions to answer using the data. The idea here is to cover in depth the steps I took to build the project.
Data cleaning and transformation
About the datasets
One of the datasets (neighbourhoods.csv) came from a public API with geospatial information of neighbourhoods from Mexico City. The other dataset (rents.csv) contains information on house/apartment rentals from (mostly) Mexico City.
Transforming neighbourhoods
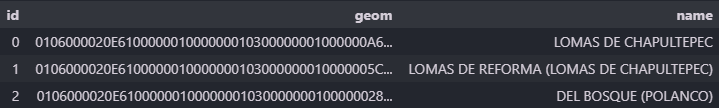
For the neighbourhoods’ dataset, I did not actually have to do much cleaning. It was just a matter of changing the column names to English to keep consistency, and removing the index column. The actual challenge for this dataset was figuring out what to do with the data in the ‘geom’ column.
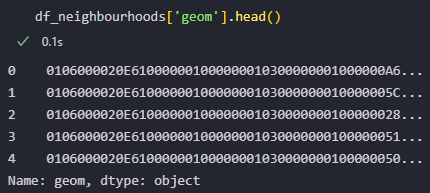
It was the first time I saw this kind of data. My intuition told me it was hexadecimal, but that was not enough to understand how to work with it. I spent over 5 hours googling until finding the answer. It turns out this is geospatial information encoded in a format called well-known binary hexadecimal. This format can be decoded using the Shapely python library, although it was not actually necessary. Here is a look at the processed data
Transforming rents
The data on this dataset came from a web scraper. It came with some inconsistency and formatting issues. Here is a peek at the raw data:
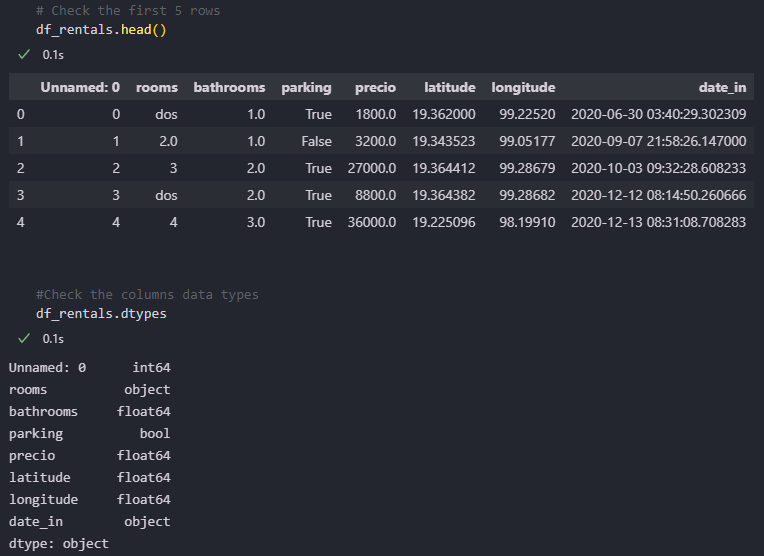
From here, we can see some steps to take: drop the “Unnamed: 0” column, fix the inconsistent values in rooms; change the “rooms” field to float and the “date_in” field to datetime, multiply the longitude values by -1 (so that the longitude actually corresponds to Mexico City), and setting all column names to English.
Other (not so obvious) necessary steps are:
- Dealing with price outliers: some prices in this data are absurdly high (and low). I decided to set every value below 1 MXN (Mexican Peso) and above 1 million MXN as null. Certainly, I could have used a more sophisticated criterion like the IQR method. Nonetheless, that would have resulted in some legitimate price values excluded from the analysis.
- Making a new “geom” column that contains geospatial information as points based on the latitude and longitude. This will be important in the loading step in the ETL.
- Creating a unique ID for every rental. Again, this is essential for the loading step.
- Setting a new column “neighbourhood_id” full of null values. The purpose of this column is to create a relation between the rents and neighbourhoods tables (in the loading step).
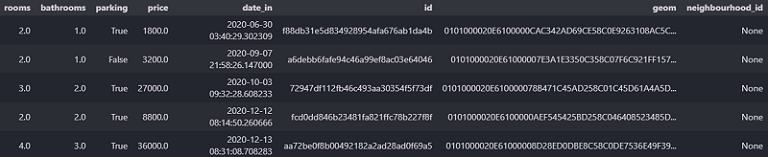
The code for all these steps is in the “transform” folder of the project GitHub repo. This is a peek of the processed data.
Data loading
For this project, I decided to use a PostgreSQL instance in Heroku, so that I could give my interviewers access to the database if needed. I choose PostgreSQL because it can handle geometrical/geographical data using the PostGIS extension.
Loading steps
- Create the database in Heroku, with the name cdmx-rents-db.
- Create a Postgres function called
assign_neighbourhood_id. More on that later. - Get the database connection URL using the following Heroku CLI command:
heroku config:get DATABASE_URL -a cdmx-rents-db
- Connect to the database using SQLAlchemy (a python ORM library).
- Enable the PostGIS extension (if not enabled).
- Generate the neighbourhoods and rents tables. Note that the neighbourhoods’ table has a one-to-many relation with the rents table (a neighbourhood can have many rentals, but one rental can only exist in one neighbourhood).
- Create a Postgres trigger that executes the
assign_neighbourhood_idfunction before every insert to the rents table. - Insert the neighbourhoods’ data, then the rents’ data (that order is important).
The code for these steps is in the load folder of the repo.
Now let’s go back to step number 2.
Reviewing step 2: Assign neighbourhood ID
The assign_neighbourhood_id function performs a check for every new rental in rents. If the rental belongs to any neighbourhood in the neighbourhoods table, then the functions assigns the rental its corresponding neighbourhood ID. Otherwise, if the rental does not belong to any neighbourhood, the rental is not inserted. This check is performed using the geom column in both rents and neighbourhoods, and a PostGIS function that verifies if a certain geometry is inside another geometry.
Analyzing the data: 3 questions
For the analysis part, I created a Tableau dashboard with you can check here. The idea behind this dashboard is that the stakeholders can get the information, regardless of whether they are short of time. As said in the first paragraph, they gave me 3 questions to answer with the data.
Which neighbourhood has the highest rent price?
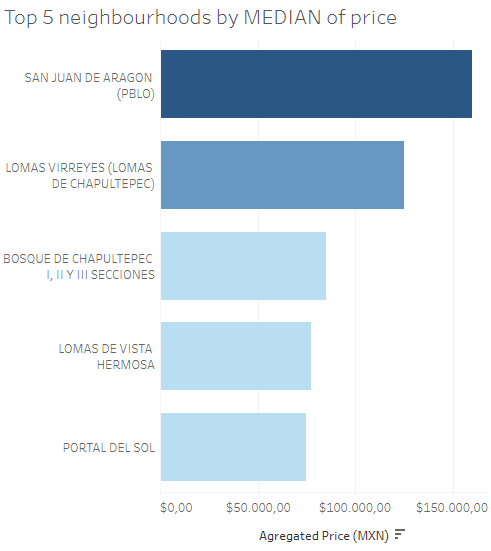
For this question (and the next one), I created a bar chart with the top 5 neighbourhoods by price, as well as an interactive map. The idea is that if you are short of time, you can see just the bar chart and move on. Otherwise, you can check every neighbourhood and its aggregated price on the map in Tableau Public (not shown here for simplicity). Also, I added an option so that you can choose which aggregation to use (median, average or sum of price).
Which neighbourhood has the most rentals?
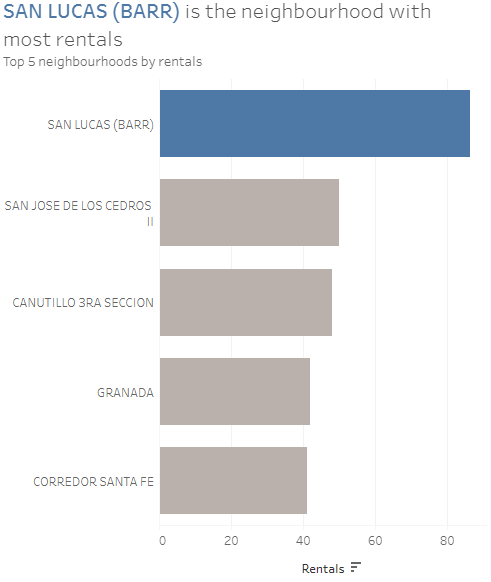
As you can see, SAN LUCAS (BARR) has almost double the number of rentals than SAN JOSE DE LOS CEDROS II.
What is the average quentity of rooms in a given neighbourhood?
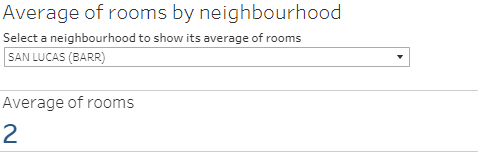
Pretty self-explanatory, right? You can go and select a neighbourhood to see its average of rooms.
Conclusion
Overall, this was a great opportunity to put my Python, SQL and Tableau skills to test. Even though they did not hire me, I am thankful that I got to showcase these skills. Implementing a basic ETL is an essential skill for most data professionals. Also, I learned a thing or two about working with geospatial data, which is easier than I expected.
I invite you to follow me on social media, and stay tuned for my future job rejection stories projects 😉.